The Empty-Unit Trap: Where Refugee Arrivals and Leasable Housing Diverge in Six US Metros
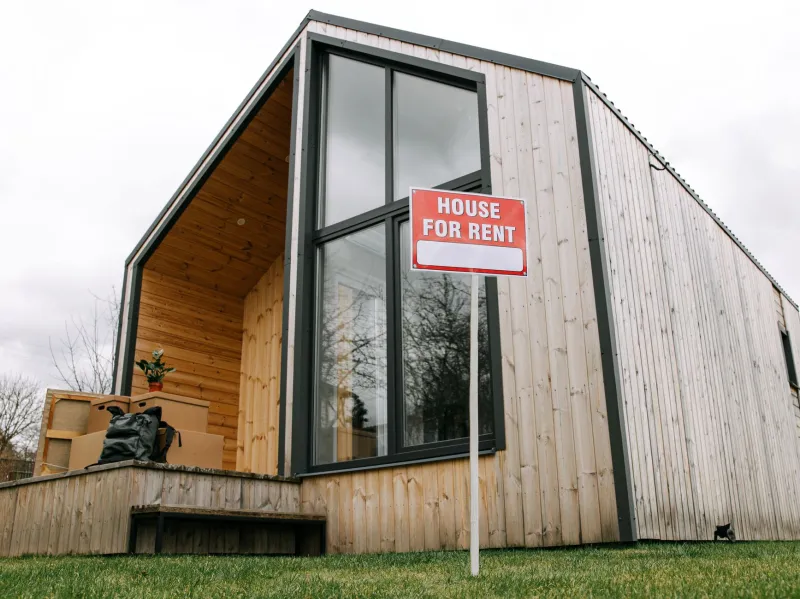
A rental vacancy rate is a poor proxy for a lease. In the six metropolitan areas where Refugee Maps compared modeled refugee arrivals with rental inventory this fall, the distance between an empty unit and a unit a newly arrived family can actually rent was not a rounding error. It was the central finding.
Most settlement maps begin with resettlement agency offices. That layer is necessary but incomplete. It shows where caseworkers sit, not where families can sign a lease. A second layer—rental vacancy—is often added as a proxy for housing opportunity. But vacancy is a physical count. Leasability is a legal, financial, and geographic filter.
Three Filters Between a Unit and a Lease
The first filter is legal availability. A unit can be vacant and still unavailable: held offline for renovation, reserved for short-term rental, tied to an age-restricted building, or subject to an owner's preference for tenants with local income history. The second is affordability. HUD's 30 percent cost-burden threshold is a blunt instrument, but it is still the best common yardstick. A vacant unit at market rent in a high-opportunity neighborhood may be less useful to a family than a slightly older unit near transit. The third is accessibility—not only wheelchair access, but access to jobs, clinics, grocery stores, and schools without a two-bus commute.
When those filters are applied, the vacancy map changes shape. In Houston, the outer-ring apartment complexes that show up as available often sit beyond frequent transit. In Buffalo, high vacancy in older stock can mask deferred maintenance and high utility costs. In the Twin Cities, transit is stronger but affordable vacancies are thin. In Phoenix, distance and heat turn a nominal vacancy into an inaccessible one. In Atlanta's suburban counties, vacancy exists but bus service does not. In Denver, cost burden absorbs much of the vacancy that exists.
Six Metros, Six Different Bottlenecks
The comparison was not designed to rank cities. It was designed to show that the same national vacancy figure produces different settlement outcomes depending on local rental markets, transit networks, and landlord practices. In Houston, navigators described a recurring mismatch: vacant units in large complexes along the Beltway, but few property managers willing to accept a family without a domestic rental history or a co-signer. In Buffalo, the bottleneck was condition. A navigator at a resettlement affiliate said the vacancy list and the habitable list were not the same document; older units often needed repairs that a new lease could not wait for.
In the Twin Cities, the constraint was price and unit size. Vacancies in older inner-ring suburbs were often studios or one-bedrooms, while arriving families included larger households. In Phoenix, the constraint was reach. A vacant unit in a far-flung suburb may be affordable on paper but impractical without a car, especially in summer heat. In Atlanta's DeKalb and Gwinnett counties, the constraint was the bus line—or its absence. In Denver, the constraint was competition: low vacancy and high rents meant that a family with a housing voucher or a modest caseworker stipend was often outbid.
These are not anecdotes that dispute the data. They are the mechanisms behind the data. A map that shows vacancy without lease terms, transit frequency, unit size, and utility costs will overstate opportunity.
What Navigators See That Arrival Counts Do Not
Arrival counts tell us how many people are entering a region. They do not tell us how many leave a temporary placement because the lease fell through, how many double up with relatives, or how many move to a second city after a month. Housing navigators track those second moves informally, and their accounts point to a consistent set of barriers: application fees, credit checks, occupancy standards, deposit requirements, and documentation requests that refugees may not be able to meet quickly.
One navigator in Houston described a property manager who required six months of domestic pay stubs—an impossible standard for a family three weeks into resettlement. Another in Buffalo described a landlord who withdrew a unit after learning that the lease would be supported by a resettlement agency. These are not universal practices, but they are common enough to shape the map. They also explain why a city can have both a high vacancy rate and a visible housing crisis for new arrivals.
Toward a Leasable-Inventory Layer
A better map would distinguish vacant units from leasable units, and leasable units from accessible ones. That requires combining American Community Survey vacancy estimates with local listing data, HUD fair market rents, transit frequencies, and unit-size distributions. It also requires publishing uncertainty. Vacancy estimates at the census-tract level are imprecise; listing data are biased toward larger property managers; transit schedules change.
None of that argues against mapping. It argues for labeling the layer honestly. A map that says 'vacancy' when it means 'potentially leasable inventory' will mislead the caseworker, the advocate, and the family. A map that separates the three filters will not solve the housing gap, but it will show where the gap is made—at the lease, not at the vacancy sign.