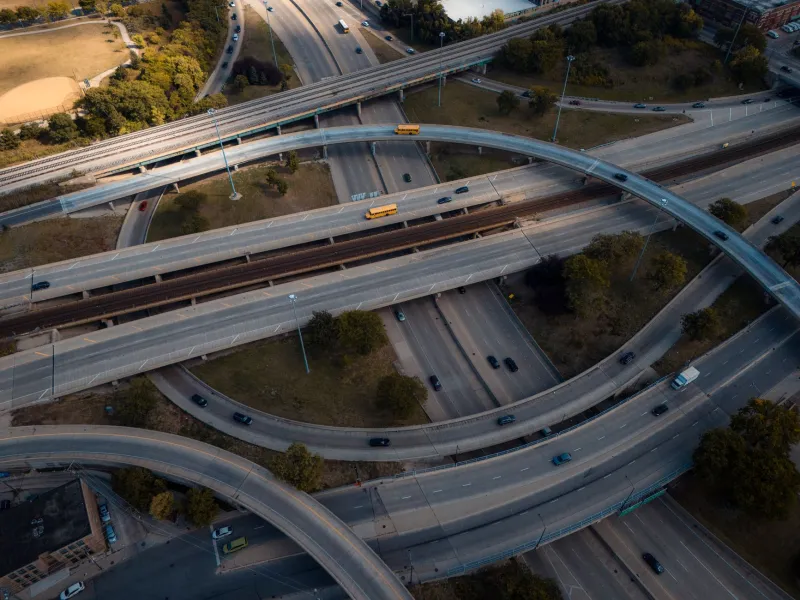
The Tide Line Is a Route: Overlaying Refugee Pathways on US Coastal Risk Maps
Photo: U.S. Navy, Public domain, via Wikimedia Commons
The 2026 Atlantic hurricane season is drawing to a close, but the maps it leaves behind remain open. Coastal cities have spent another year responding to housing damage, school disruptions, and service gaps. Many still describe climate displacement as a future problem. That framing is increasingly difficult to defend. Displacement is already a planning question, and it is one that can be mapped now with public data, aggregate refugee-route information, and a clear ethical framework.
A Season Closes, a Map Remains Open
Hurricane seasons do not end neatly for the people they displace. A storm may pass, but the relocation that follows can last for months or become permanent. In US coastal cities, climate risk maps already identify flood zones, storm surge areas, and vulnerable housing. Refugee-route data can identify where displaced people are likely to arrive from the Caribbean and Central America, and where resettlement networks already concentrate. Kept separate, these maps produce incomplete preparedness. Overlaid, they reveal where housing, schools, health services, and resettlement capacity are likely to face simultaneous pressure.
This is not a call to predict individual movement. It is a call to prepare systems. A city that is both a resettlement destination and a climate-receiving area needs to see both roles on the same page. If it plans for one and not the other, it will improvise during the next emergency.
Two Routes, One Map
International and domestic displacement are often mapped by different agencies with different vocabularies. The first is described as refugee resettlement or humanitarian admission. The second is described as disaster displacement, managed retreat, or internal relocation. For a receiving city, the distinction matters legally but not always operationally. Families arriving from abroad and families moving inland from a flooded neighborhood may need the same scarce apartments, the same school seats, and the same language-access services.
A useful map would show both routes as converging flows. It would mark coastal gateway cities, inland receiving areas, resettlement agency offices, state refugee coordinator service regions, public housing authorities, school districts, and health facilities. It would then layer climate-risk projections and social vulnerability data on top. The result would not be a prediction of who will move. It would be a picture of where existing systems are thin.
What to Overlay
Public data can support this work without exposing individuals. FEMA and NOAA flood and storm-surge layers provide the physical risk base. Census and social vulnerability data show where households have fewer resources to absorb disruption. HUD housing data, school enrollment projections, and transit access show capacity constraints. State and local resettlement maps show where service providers already operate.
Refugee-route data should be used at an aggregate level: arrivals by region or country of origin, placement by state or county, and trends over time. The overlay should use scenarios and ranges, not fixed points. A map that says a specific neighborhood will receive a specific number of people invites both false confidence and political backlash. A map that says several counties share a combination of high housing stress, limited English-learner capacity, and elevated flood risk gives planners something they can act on.
The Ethical Trap: Anticipating Without Protecting
Climate displacement mapping carries a particular risk. Maps that identify vulnerable groups can be used to welcome them, but they can also be used to stigmatize them or to justify exclusion. Publishing fine-grained estimates about where displaced people will settle can expose families to surveillance, landlord discrimination, or community resistance. The ethical standard should be aggregate, purpose-limited, and reviewed with affected communities.
That means suppressing small counts, avoiding address-level data, and refusing to publish maps that could function as targeting tools. It means distinguishing clearly between climate risk and displacement likelihood. It also means asking who benefits from the map and who bears its risks. A preparedness map should help a city open services, not help an agency rank neighborhoods for enforcement.
A Preparedness Agenda for 2027
Before the next hurricane season, coastal cities can take practical steps. Emergency management, housing, schools, public health, and resettlement agencies should meet around a shared aggregate map. They should adopt data-sharing agreements that protect individual privacy. They should identify capacity gaps in advance: temporary housing, English-learner staffing, health screening, transportation, and language access.
Advocates have a role in demanding that this work be public and participatory. City councils and county boards can ask whether their hazard mitigation plans include displacement reception. State refugee coordinators can connect resettlement data to local emergency planning. Community organizations that serve both newly arrived and long-term residents can identify the overlapping needs that a purely administrative map would miss.
The cost of waiting is not abstract. If cities wait until after the next storm, they will map displacement in retrospect, under pressure, with incomplete data. If they overlay the routes now, they can see where the tide line and the refugee route meet. That does not solve displacement. It does make the pressure visible before it becomes a crisis.