Degrees of Arrival: A Reproducible Heat-Risk Map for Refugee Settlement Neighborhoods
The Map Begins Where the Route Ends
Refugee mapping has long focused on movement: corridors, checkpoints, transit gaps, and the last mile from airport to apartment. In 2026, another geography matters just as much. For families resettled into US neighborhoods, the destination itself is a climate exposure. Extreme heat is no longer a seasonal inconvenience in Phoenix, Houston, or even parts of the Upper Midwest; it is a public-health condition that shapes how newcomers use transit, reach appointments, and cool their homes.
This article proposes a reproducible method for mapping heat risk in refugee arrival neighborhoods. It is deliberately modest. The output is a descriptive overlay—not a causal model of resettlement outcomes. Used carefully, the map can help local advocates direct cooling resources, utility assistance, and shade infrastructure toward blocks where exposure compounds. Used carelessly, it can become another overconfident visual that implies more than the data can support.
Four Layers, One Composite
The method uses four inputs, each available from public or publicly accountable sources. The sequence matters because the layers answer different questions.
1. Summer heat index. Use National Weather Service or CDC heat-index normals for July and August, preferably at the county or forecast-zone level. Where finer resolution is available, use land-surface temperature from satellite products as a supplement, not a substitute. Heat index reflects human perceived heat; surface temperature reflects pavement and rooftops. They are related but not interchangeable.
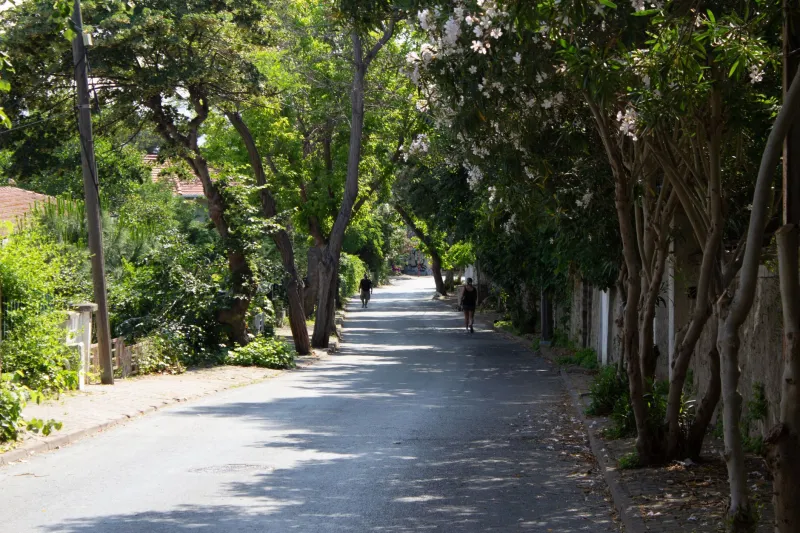
2. Tree-canopy cover. The National Land Cover Database and local canopy assessments provide a consistent starting point. Canopy is a useful proxy for shade, but it is not the same as shade at midday on a sidewalk. A neighborhood with high canopy in parks and low canopy along arterial streets can look deceptively green in a coarse raster.
3. Housing age and type. American Community Survey tables on year built, renter occupancy, and structure type help identify older housing stock that may lack central air conditioning or efficient insulation. Housing age is not a direct measure of cooling access; it is a screening variable. Pair it with local utility-shutoff data and weatherization program enrollment where available.
4. Refugee arrival ZIP codes. Resettlement arrival data are often published at the county or metro level, and small-number suppression is common. Where ZIP-level arrival counts are available through state refugee coordinators or local resettlement agencies, use them with suppression thresholds. Where they are not, map arrival neighborhoods at the county subdivision or census tract level and state the limitation plainly.
From Overlay to Interpretation
A composite heat-risk map should be built in two passes. The first pass is descriptive: where do high heat index, low canopy, older housing, and refugee arrival overlap? The second pass is interpretive: what does that overlap mean for service delivery?
The distinction between descriptive and causal claims is not academic. A map showing that arrival neighborhoods have less canopy and older housing does not prove that heat is causing worse resettlement outcomes. Families may be arriving into neighborhoods with strong mutual-aid networks, subsidized cooling programs, or proximity to clinics. Heat exposure is one burden among many, and the map should say so.
To keep the visual honest, label each layer with its source, vintage, and spatial resolution. Avoid a single “risk score” unless the weighting is transparent and adjustable. A better approach is a small-multiple layout: one panel per layer, plus a combined panel that uses ordinal categories such as “high heat / low canopy / older housing” rather than a false-precision index.
What Advocates Can Do With It
The practical value of the map lies in pairing it with action. Three uses are especially defensible.
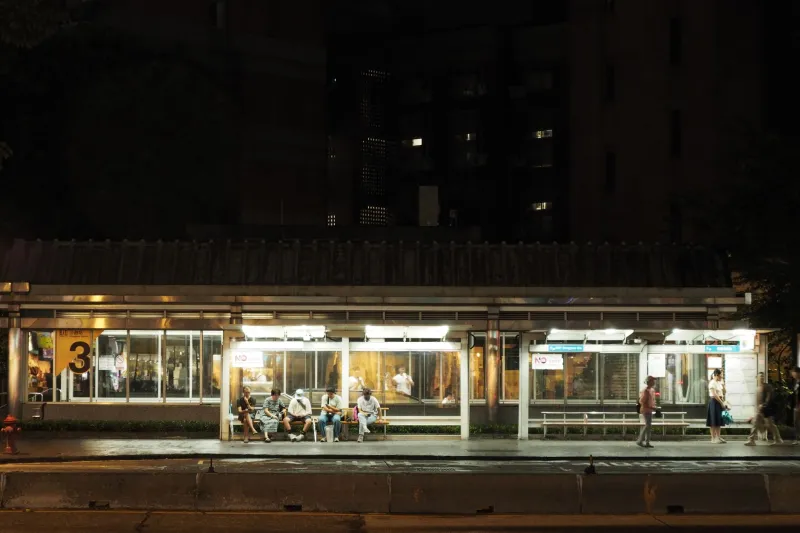
Cooling-center access. Overlay the heat-risk composite with cooling-center locations and transit stops. A neighborhood may have a cooling center within a mile but no shaded walking route or frequent bus service. The map can identify where a new cooling site or extended hours would reduce the largest access gap.
Utility assistance targeting. Summer utility bills are a recurring stress for newly arrived households. Map the heat-risk composite against LIHEAP enrollment and shutoff moratoria. Where high-exposure blocks show low program uptake, the gap may reflect language access, documentation barriers, or simple lack of outreach.
Shade infrastructure. Canopy gaps are long-term investments, but they are also immediate planning signals. Street-tree planting, bus-shelter shade, and schoolyard shade can be sequenced toward blocks with the highest compound exposure. A map does not plant a tree, but it can help a city decide where the first hundred go.
Limits Worth Stating Up Front
Every heat map is a simplification. Canopy data lag behind new plantings and removals. Housing age does not capture whether a unit has a working air conditioner. Refugee arrival data may be stale by the time it is published, and small populations are often suppressed. Heat index normals describe climate, not the indoor conditions where people actually sleep.
These limits do not make the map useless. They make it a screening tool. The right posture is to publish the method, the caveats, and the update schedule alongside the map. Invite local corrections. A refugee arrival neighborhood is not a laboratory; it is a place where people are building new lives under conditions that a map can help make visible.
A Reproducible Protocol
For teams that want to replicate the method, the sequence is straightforward: acquire heat-index normals, canopy rasters, ACS housing tables, and arrival counts; align all layers to a common census geography; document suppression rules; produce small multiples before composites; and pair every map with a service-layer overlay. Publish the codebook, not just the image.
The larger point is editorial as much as technical. Refugee mapping should not stop at the airport. The conditions waiting at the destination—heat, shade, housing, and access—belong on the map too. The task is to draw them without claiming more than they can bear.