The 4 A.M. Handoff: Mapping Infant Care Gaps Against Refugee Shift Work
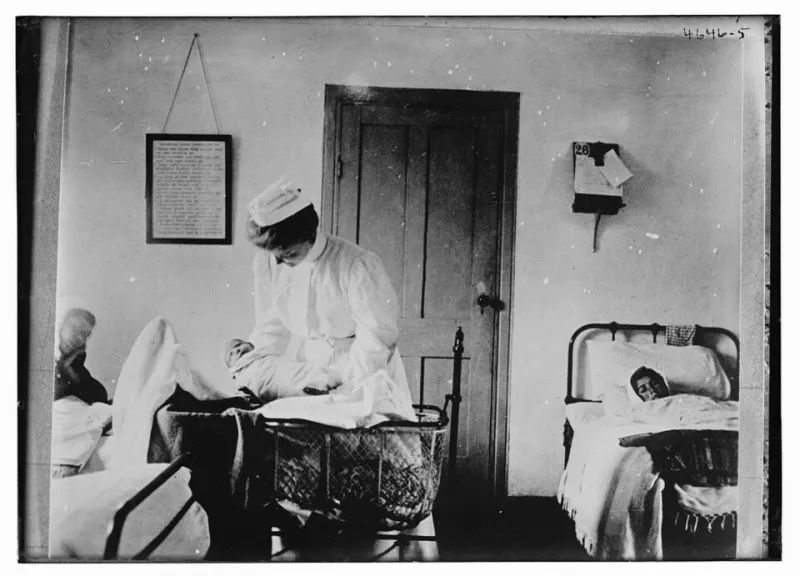
Photo: The Library of Congress, Public domain, via Wikimedia Commons
Introduction
For a newly arrived refugee parent, the first job offer often arrives with a schedule attached: a 5 a.m. warehouse shift, a rotating hospital laundry assignment, a food-processing line that starts before dawn. The resettlement map usually shows the apartment, the bus line, the school, and the clinic. It rarely shows the licensed infant or toddler slot that makes the shift possible. That omission is not cosmetic. It can turn a routine employment pathway into a daily crisis and help explain why some households plateau economically even when housing and transit appear adequate.
This article proposes treating infant and toddler care as resettlement infrastructure, on par with transit and schools. It outlines a reproducible method for overlaying refugee settlement ZIP codes, licensed infant and toddler capacity, and shift-work employer locations in six U.S. metros. It is not a ranking of cities or families. It is an audit protocol: a way to ask where care is scarce at the hours and places where refugee parents are most likely to work.
Why care belongs in the same layer as transit
Housing maps answer where people sleep. Transit maps answer how they move. School maps answer where children spend the day. Childcare maps answer a different and equally basic question: who can accept a job, and at what hour? For families with children under three, licensed infant and toddler care is often the binding constraint. Unlike K–12 schooling, it is not guaranteed, not free at point of use, and not organized around shift work. A center that opens at 7:30 a.m. cannot serve a parent who must clock in at 5 a.m.; a slot twenty minutes away by car may be unreachable by bus at that hour.
When resettlement maps leave this layer blank, they imply that employment barriers are primarily about skills or language. Those matter. But a map that shows a warehouse job and a bus route while omitting the absence of an infant slot is not neutral; it is incomplete. It can lead agencies to celebrate job placement while parents quietly decline offers, reduce hours, or rely on informal care that is fragile and invisible.
A reproducible six-metro overlay
The method has four inputs. First, define the settlement footprint: ZIP Code Tabulation Areas (ZCTAs) where refugee arrivals have been resettled in the most recent three fiscal years, using public resettlement data or local agency counts where available. Second, assemble licensed infant and toddler capacity: provider addresses, licensed capacity for ages 0–2, operating hours, and subsidy acceptance status from state licensing databases. Third, geocode shift-work employers: warehousing and distribution, food processing, hospitals, airports, hospitality laundry, and similar employers with nonstandard start or end times. Fourth, add transit or travel-time estimates for the early-morning and late-evening windows when those employers operate.
The unit of analysis should be the ZCTA, not the city. Metro averages hide the fact that a resettlement cluster may sit in one ZIP code while infant capacity sits in another, across a highway or a transit gap. For each ZCTA, calculate three ratios: licensed infant slots per 100 children under three; slots per 100 estimated refugee households with children under three; and the share of shift-work employers within a 30-minute transit trip of at least one licensed infant slot that opens before 6 a.m. or closes after 8 p.m. The third ratio is the one that most directly tests the 4 a.m. handoff.
A six-metro pilot—Atlanta, Chicago, Houston, Minneapolis–St. Paul, Phoenix, and Buffalo—would capture different resettlement histories, labor markets, and licensing regimes. The point is not to compare cities on a single scale. It is to see whether the same structural gap appears under different conditions.
What licensing data can and cannot show
Licensed capacity is not the same as available capacity. A provider may be licensed for twelve infants but fully enrolled, or may hold a license while not accepting children under one. State databases vary in whether they report age-specific capacity, hours, subsidy contracts, and language capacity. Family child care homes are often licensed but harder to geocode because addresses may be residential and sometimes suppressed. License-exempt care—care by relatives, friends, or neighbors—is largely absent from administrative data, yet it is often the workaround that allows a parent to take an early shift.
These limits should be displayed, not buried. A map that treats licensing records as a complete census of care will overstate scarcity in some neighborhoods and understate it in others. A stronger protocol adds two caveats to every layer: first, capacity is a ceiling, not a vacancy; second, the absence of a licensed provider does not mean the absence of care. It means the care is outside the regulated market and therefore outside the map.
Reading the gaps without overreading them
A care gap is not proof that families are making poor choices or that agencies are failing. It is a signal to ask a more precise question. Is the gap about supply—too few licensed infant slots? About hours—slots that exist but not at 5 a.m.? About cost—slots that are licensed but unaffordable after subsidy? About transportation—slots that are close on a map but unreachable at shift change? About language or trust—slots that exist but are not accessible to a newly arrived family? Each answer implies a different intervention.
The map should therefore be read as a triage tool, not a verdict. It can identify ZCTAs where infant capacity, shift-work employment, and refugee settlement overlap most tightly. It can show where a single new infant room or a subsidized extended-hours contract would relieve the most pressure. It can also show where the apparent gap is an artifact of licensing data and should be investigated with local providers.
Questions for advocates and agencies
Before a local agency funds new care capacity, it should be able to answer a short set of questions. Where do refugee parents actually work, and what are the start and end times of those shifts? How many licensed infant slots exist within a 30-minute transit trip at those hours? Do those providers accept child care subsidies, and do they have capacity for children under one? What informal care arrangements are families using now, and what would make those arrangements more stable? Are there family child care providers who could be supported to extend hours or become subsidy-eligible? And does the resettlement map used by local planners include any of this, or does it stop at housing and transit?
Childcare is not a secondary service that families arrange after resettlement succeeds. For parents of infants and toddlers, it is the condition that makes early employment possible. A resettlement map that omits it is not merely incomplete; it misreads the route. The 4 a.m. handoff belongs on the map.