Where the Van Turns: Auditing Mobile Health Coverage Against Refugee Arrival Geography
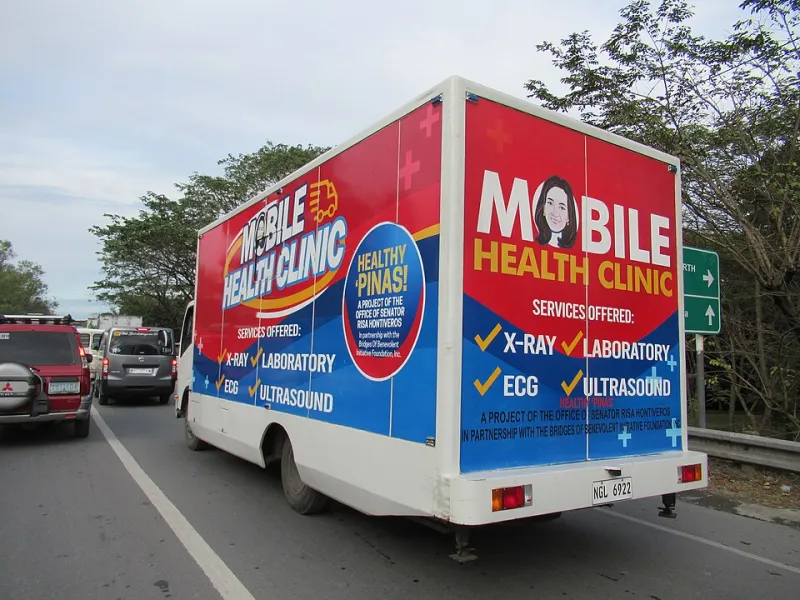
Photo: FBenjr123, CC BY-SA 4.0, via Wikimedia Commons
Mobile health units occupy a peculiar place in refugee arrival metros. They are praised for flexibility, funded for outreach, and counted by visits. Yet the most important fact about a mobile clinic is often missing from the program report: where it actually goes. For a mapping project concerned with displacement, the van route is not background logistics. It is a service layer with geography, and it can be audited like any other layer.
The practical question is not whether mobile care exists in a city that receives refugees. It is whether the route intersects the neighborhoods where arrivals are settling, the transit gaps they face, and the appointment barriers that make a fixed clinic difficult to reach. A van that serves the easiest sites may still produce impressive visit totals while leaving the hardest-to-reach arrival clusters outside its footprint. This article sets out an audit protocol for researchers and advocates who want to test that alignment without overclaiming what the data can show.
The route is the unit of analysis
Start with the schedule, but do not stop there. Public-facing mobile unit calendars usually list stops, dates, and service types. Operational logs may add arrival and departure times, staff capacity, and whether a stop was cancelled or shortened. Geocode every stop to the building or block level, then record the service window and dwell time. A stop with a two-hour window and one provider is not equivalent to a four-hour stop with a vaccination team and a caseworker.
Distinguish among route types. Some mobile units run a fixed rotation of community sites. Others respond to requests, disasters, or school calendars. Still others appear only at events. Each produces a different geography. A fixed rotation can be mapped as a repeatable layer. An on-demand route requires a longer observation period. A single week in 2026 should not be treated as the permanent shape of a program.
Build the arrival denominator first
Coverage claims require a denominator. In US arrival metros, that denominator is rarely a single authoritative count. Resettlement agency placements, school enrollment records, language-access data, and census tract estimates each capture different populations and different time windows. Refugees, asylees, parolees, and other arrivals may not appear in the same dataset.
Use multiple proxies and state their limits. Define the study area before drawing catchments. If the audit focuses on recent arrivals, say what recent means. If it includes broader immigrant populations, say so. The goal is not a perfect count but a defensible comparison: which parts of the arrival geography are plausibly within reach of the mobile route, and which are not.
Overlay transit and appointment barriers
Mobile care is often justified as a response to travel burden. That justification should appear on the map. Overlay transit coverage, vehicle access, and estimated travel time to fixed clinics. Then ask whether mobile stops are located in places where those burdens are highest. A stop near a major arterial road may be easy for the van to reach and hard for residents without a car.
Appointment barriers belong in the same analysis. If the fixed clinic requires a phone call, an online portal, or a referral, a mobile unit that offers walk-in service changes access even when the distance is short. Map the barriers as attributes, not as vague context. Record whether a stop offers interpretation, whether it requires identification, and whether it can connect patients to primary care. These details determine whether a stop is reachable in practice.
Coverage is not the same as contact
Visit counts measure contact. They do not measure coverage. A van may see many patients at a well-known community center while never visiting a smaller arrival cluster across the river. An audit should identify arrival areas outside the route catchment, then compare that gap with the program's stated priorities.
Define reach carefully. Is it a ten-minute walk from the stop? A fifteen-minute transit trip? A reasonable drive? Use a range of thresholds and report how the gap changes. Avoid implying that every resident of a census tract is a potential patient. Aggregate the analysis to protect privacy, and do not publish precise locations of vulnerable populations.
Field checks and ethical limits
A route map is not a substitute for provider knowledge. Field checks with mobile unit staff, community organizations, and clinic navigators can explain why a stop was added, moved, or dropped. They can also reveal barriers that never appear in scheduling data, such as lack of a host site, parking restrictions, or safety concerns.
The ethical caution is straightforward: do not turn an audit into a surveillance tool. Publish aggregated coverage findings, not patient locations. Coordinate with providers before releasing stop-level data. Where a stop serves a small arrival community, consider whether mapping it at all could identify the people it serves. The point is to improve reach, not to expose need.
A short scorecard for advocates
A useful audit can begin with a few questions. Are mobile stops geocoded in program records? Is the schedule public and stable enough to map? Do stops fall inside or near arrival clusters? What share of service capacity is allocated to the highest-burden areas? Are transit gaps and interpretation needs recorded alongside visit counts? Does the program adjust its route when arrival geography changes?
These questions do not require a perfect dataset. They require consistency. A van route mapped against arrival clusters, transit gaps, and appointment barriers gives researchers and advocates a clearer picture of whether mobile care is closing a gap or circling it. In a field that often counts outputs, the route itself is a useful accountability layer.